GeoScript
The GeoSpatial Swiss Army Knife
Jared Erickson & Justin Deoliveira
What is GeoScript?
Spatial capabilities for scripting languages on the JVM.
- Groovy, Python, Javascript, Scala, Ruby
- Similar API across languages
- Convenience for JTS and GeoTools
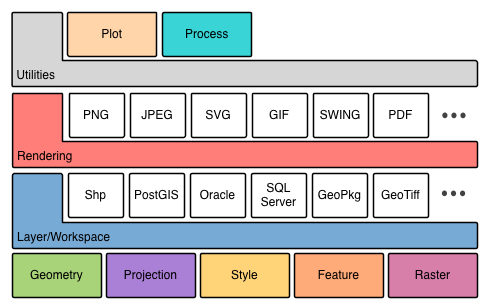
GeoScript Modules
Buffer a Point
Java
GeometryFactory geometryFactory = new GeometryFactory();
Point point = geometryFactory.createPoint(new Coordinate(-122.478899, 47.268195));
point.buffer(10);
Buffer a Point
Groovy
new Point(-122.478899, 47.268195).buffer(10)
Python
Point(-122.478899, 47.268195).buffer(10)
Render a Map
Java
StyleFactory styleFactory = CommonFactoryFinder.getStyleFactory(null);
SLDParser parser = new SLDParser(styleFactory, new File("states.sld"));
Style style = parser.readXML()[0];

ShapefileDataStore shapefile = new ShapefileDataStore(new File("states.shp").toURI().oURL());
FeatureSource<SimpleFeatureType, SimpleFeature> features =
   shapefile.getFeatureSource(shapefile.getTypeNames()[0]);

MapContext context = new DefaultMapContext(new MapLayer[]{
 new DefaultMapLayer(features, style)
});

BufferedImage image = new BufferedImage(300, 300, BufferedImage.TYPE_INT_ARGB);
Graphics2D graphics = image.createGraphics();
Rectangle screenArea = new Rectangle(0, 0, 300, 300);
ReferencedEnvelope mapArea = features.getBounds();

StreamingRenderer renderer = new StreamingRenderer();
renderer.setContext(context);
renderer.paint(graphics, screenArea, mapArea);

ImageIO.write(image, "png", new File("states.png"));
Render a Map
Groovy
Layer layer = new Shapefile("states.shp")
layer.style = new SLDReader().read(new File("states.sld"))

Map map = new Map(layers: [layer], width: 300, height: 300)
map.render(new File("states.png"))
Load PostGIS Features
Java
Map<String, Object> params = new HashMap<String, Object>();
params.put("dbtype", "postgis");
params.put("database", "usa");
params.put("schema", "public");
params.put("host", "localhost");
params.put("port", "5432");
params.put("user", "bob");

DataStore dataStore = DataStoreFinder.getDataStore(params);
try {
   SimpleFeatureSource featureSource = dataStore.getFeatureSource("states");
   SimpleFeatureCollection featureCollection = featureSource.getFeatures();
   SimpleFeatureIterator it = featureCollection.features();
   try {
     while(it.hasNext()) {
       SimpleFeature f = it.next();
       System.out.println(f.getAttribute("STATE_NAME") + " at " + ((Geometry)f.DefaultGeometry()).getCentroid().toText());
     }
   } finally {
      it.close();
   }
} finally {
   dataStore.dispose();
}
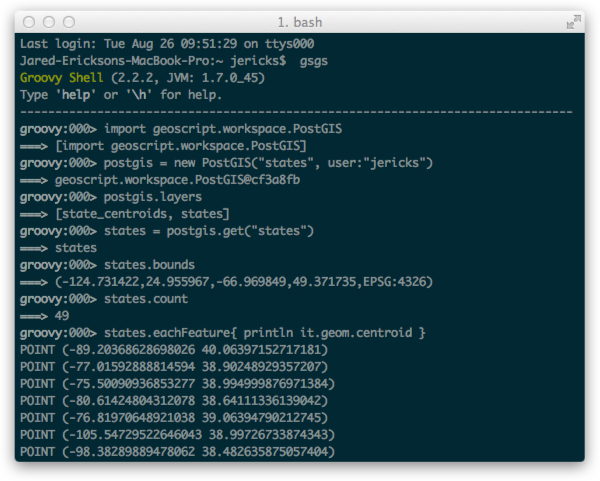
Load PostGIS Features
Python
PostGIS db = new PostGIS('usa', user: 'bob')
for f in db['states'].features():
  print '%s at %s' % (f['STATE_NAME'], f.geom.centroid)
Create a Shapefile
Java
SimpleFeatureTypeBuilder featureTypeBuilder = new SimpleFeatureTypeBuilder();
featureTypeBuilder.setName("points");
featureTypeBuilder.setSRS("EPSG:4326");
featureTypeBuilder.add("the_geom", Point);
featureTypeBuilder.add("id", Integer);
featureTypeBuilder.add("name", String);

SimpleFeatureType featureType = featureTypeBuilder.buildFeatureType();

File file = new File("points.shp");
Map<String,Object> params = new HashMap<String, Object>();
params.put("url", DataUtilities.fileToURL(file));

DataStore dataStore = DataStoreFinder.getDataStore(params);
dataStore.createSchema(featureType);
SimpleFeatureStore featureStore = (SimpleFeatureStore) dataStore.FeatureSource("points");

SimpleFeatureBuilder featureBuilder = new SimpleFeatureBuilder(featureType);
GeometryFactory geometryFactory = new GeometryFactory();

FeatureCollection features = new DefaultFeatureCollection(null, featureType)

featureBuilder.add(geometryFactory.createPoint(new Coordinate(1, 1)));
featureBuilder.add(1);
featureBuilder.add("one");
features.add(featureBuilder.buildFeature(null));

featureBuilder.add(geometryFactory.createPoint(new Coordinate(2, 2)));
featureBuilder.add(2);
featureBuilder.add("two");
features.add(featureBuilder.buildFeature(null));

featureStore.addFeatures(features);

dataStore.dispose();
Create a Shapefile
JavaScript
var dir = new Directory('.');
var shp = dir.add(new Layer({
  name: 'points',
  fields: [{
    name: 'geom', type: 'Point'
  }, {
    name: 'id', type: 'Integer'
  }, {
    name: 'name', type: 'String'
  }]
});
shp.add([new Point([1,1], 1, 'one')]);
shp.add([new Point([2,2], 2, 'two')]);
What else can I do with GeoScript?
Read, write, and translate spatial formats
import geoscript.workspace.*
import geoscript.layer.Layer

File dir = new File("shp")
PostGIS postgis = new PostGIS("naturalearth")
Directory directory = new Directory(dir)
directory.layers.each { Layer layer ->
    postgis.add(layer)
}
Encode and decode exchange formats like GeoJSON, GML, WKT, and WKB
from geoscript.geom import readJSON, writeGML, readWKT, writeWKB
writeGML(readJSON("""{"type":"Point", "coordinates":[1,2]}"""))
writeWKB(readWKT("POINT (1 2)"))
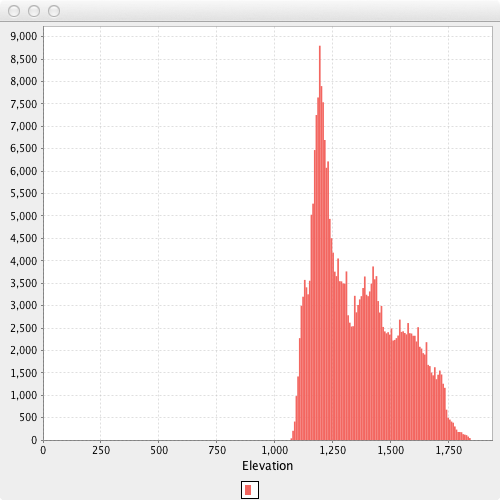
Analyze data distribution
from geoscript.layer import GeoTIFF
dem = GeoTIFF('dem.tif')

h = dem.histogram()
data = zip(map(lambda (x,y): y, h.bins()), h.counts())

bar.xy(data, xlabel='Elevation').show()
Analyze data distribution
Process and transform data on the fly
var proj = require('geoscript/proj')
var Directory = require('geoscript/workspace').Directory
var Layer = require('geoscript/layer').Layer

var shp = new Directory('.').get('states.shp')
var points = new Layer({
  name: 'Points',
  fields: [{
    name: 'geom', type: 'Point'
  }]
});

shp.features.forEach(function(f) {
  points.add({
      name: proj.transform(f.get('geom').centroid), "epsg:4326", "epsg:26912"
  });
});
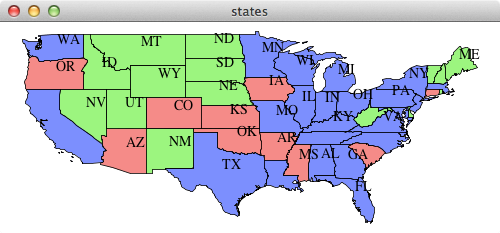
Generate styles for rendering maps
from geoscript.style import *
from geoscript.render import *
from geoscript.layer import Shapefile

style = Fill('#4DFF4D', 0.7).where('PERSONS < 2000000')
style +=  Fill('#FF4D4D',0.7).where('PERSONS BETWEEN 2000000 AND 4000000')
style += Fill('#4D4DFF',0.7).where('PERSONS > 4000000')
style += Stroke(width=0.2) + Label('STATE_ABBR', 'Times New Roman 14px')

draw(Shapefile('states.shp'), style)
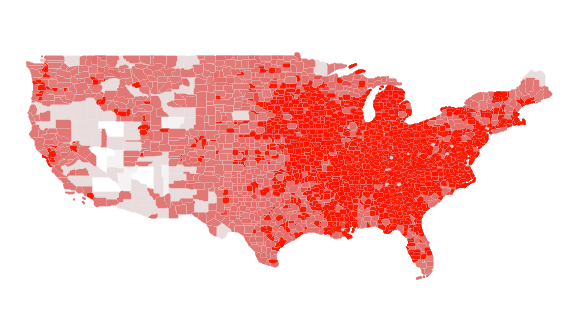
Generate styles for rendering maps
Generate styles for rendering maps
shp = Shapefile('counties.shp')
areas = [f['ALAND'] for f in shp.features()]

ranges = map(lambda r: 'ALAND BETWEEN %f AND %f'%r, zip(areas[:-1], areas[1:]))
fills = Fill('white').interpolate(Fill('red'), n=99)

style = reduce(lambda x,y:x+y, map(lambda (f,r): f.where(r), zip(fills, ranges)))

draw(shp, style, format='mapwindow')
Generate styles for rendering maps
Crop Raster with a Geometry
import geoscript.layer.*
import geoscript.geom.Point
import geoscript.proj.Projection

def tif = new GeoTIFF(new File("raster.tif"))
def raster = tif.read(new Projection("EPSG:4326"))

def geom = new Point(50,50).buffer(20)
def cropped = raster.crop(geom)

new GeoTIFF(new File("raster_circle_cropped.tif")).write(cropped)
Crop Raster with a Geometry
How can I use GeoScript?
Read Eval Print Loop (REPL)
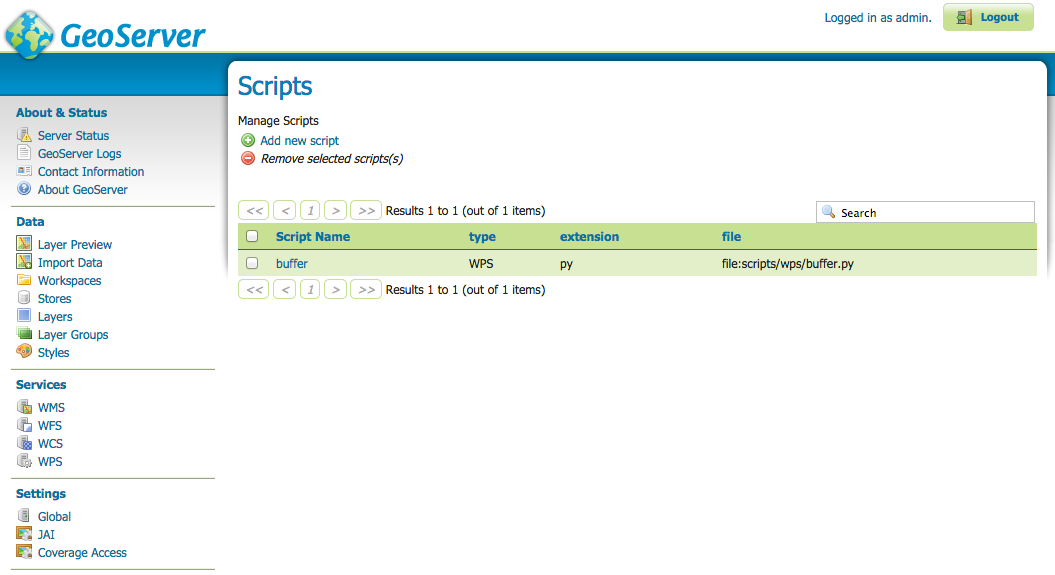
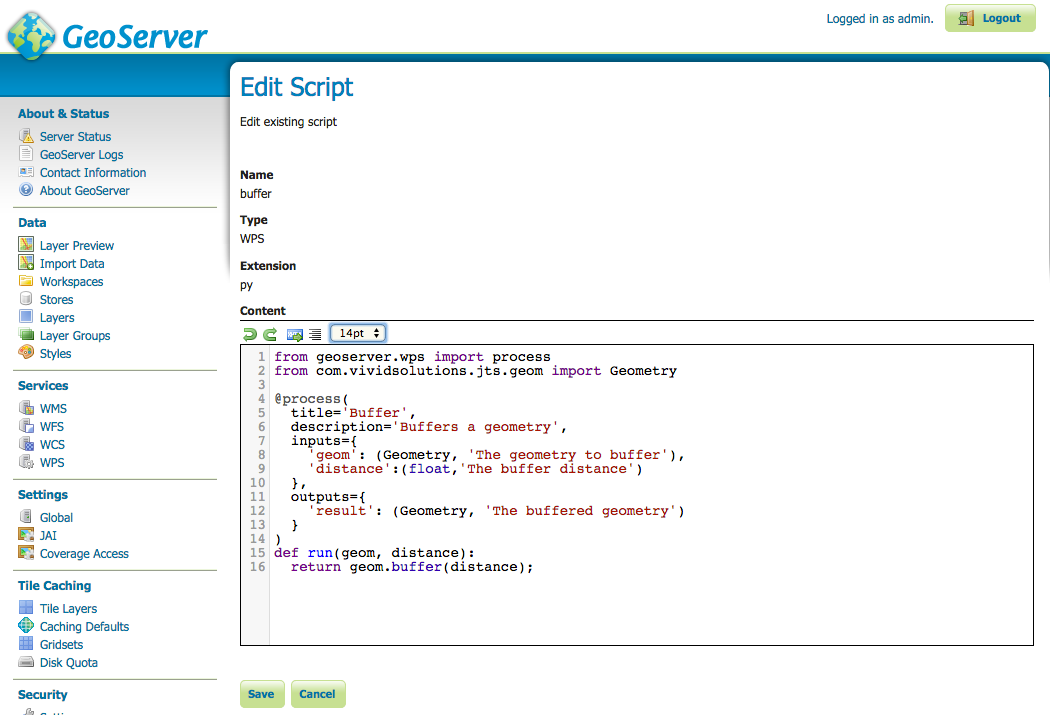
GeoServer WPS
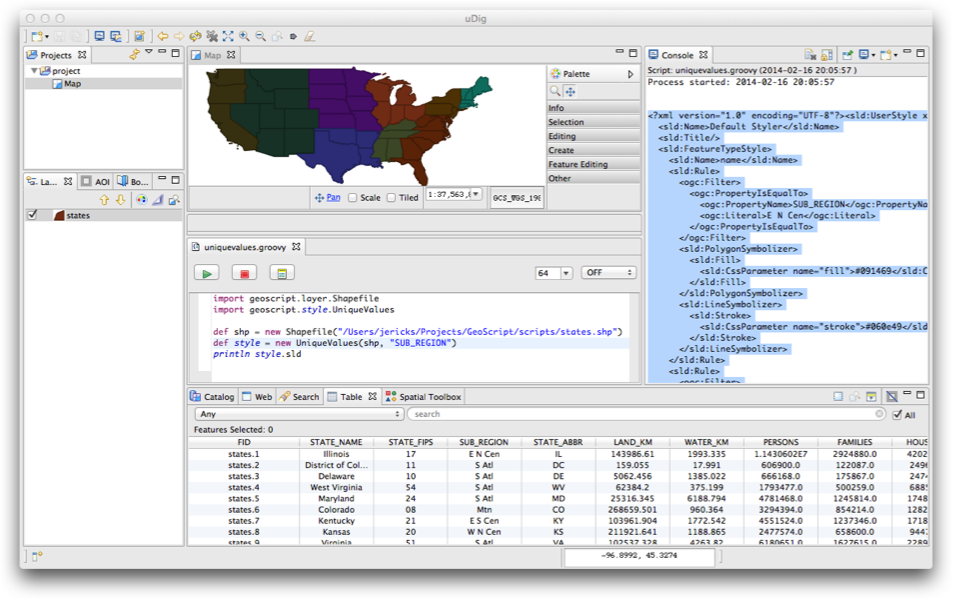
uDig Spatial Toolbox
As a Library
<repository>
    <id>boundless</id>
    <name>Boundless Maven Repository</name>
    <url>http://repo.boundlessgeo.com/main</url>
    <snapshots>
        <enabled>true</enabled>
    </snapshots>
</repository>
<dependency>
    <groupId>org.geoscript</groupId>
    <artifactId>geoscript-groovy</artifactId>
    <version>1.3</version>
</dependency>
repositories {
  maven {
     url "http://repo.boundlessgeo.com/main"
  }
}
dependencies {
  compile "org.geoscript:geoscript-py:1.3"
}
http://locationtech.org
Some Real World Examples
Land Area Statistics
WNV Spatial Analysis
WNV Spatial Analysis
Goal was to create an animated map showing spread of WNV by state
CDC Data in PDF
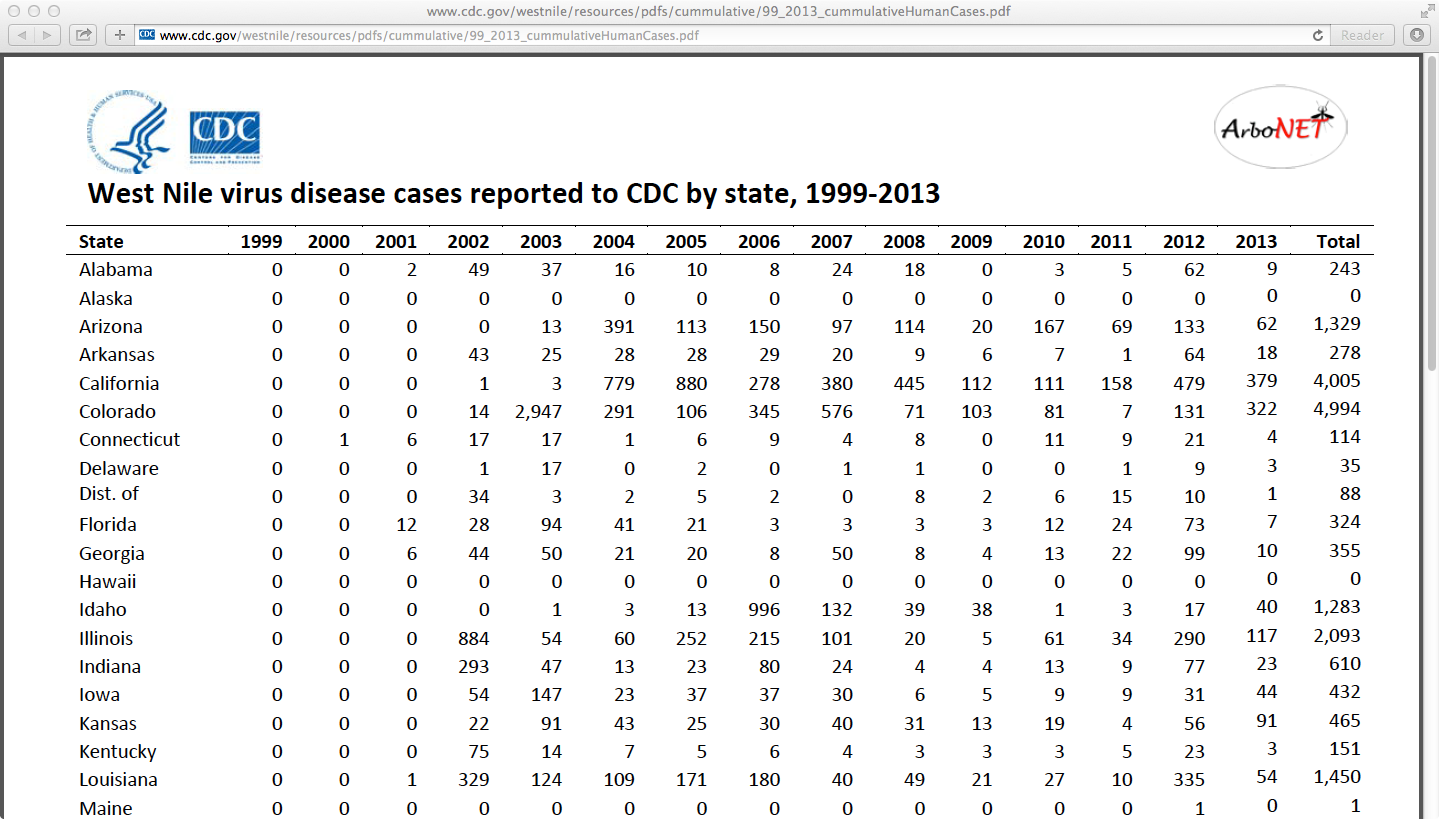
Get Text from PDF
@Grapes(
    @Grab(group='com.lowagie', module='itext', version='2.1.7')
)
import com.lowagie.text.pdf.parser.PdfTextExtractor
import com.lowagie.text.pdf.PdfReader

// Use iText to extract text from PDF
URL url = new URL("http://www.cdc.gov/westnile/resources/pdfs/cummulative/99_2013_cummulativeHumanCases.pdf")
PdfReader reader = new PdfReader(url)
PdfTextExtractor parser =new PdfTextExtractor(reader)

// Write text to a file in the data directory
File dir = new File("data")
dir.mkdir()
File file = new File(dir, "data.dat")
file.write(parser.getTextFromPage(1))
Convert text into CSV
State,1999,2000,2001,2002,2003,2004,2005,2006,2007,2008,2009,2010,2011,2012,2013,Total
Alabama,0,0,2,49,37,16,10,8,24,18,0,3,5,62,9,243
Alaska,0,0,0,0,0,0,0,0,0,0,0,0,0,0,0,0
Arizona,0,0,0,0,13,391,113,150,97,114,20,167,69,133,62,1329
Arkansas,0,0,0,43,25,28,28,29,20,9,6,7,1,64,18,278
...
Get data from Natural Earth
URL url = new URL("http://www.naturalearthdata.com/http//www.naturalearthdata.com/download/110m/cultural/ne_110m_admin_1_states_provinces_lakes.zip")
File file = new File("data/ne_110m_admin_1_states_provinces_lakes.zip")
if (!file.exists()) {
	url.withInputStream { inp ->
    	file.withOutputStream { out ->
        	out << inp
    	}
    }
}
File dir = new File("data")
def ant = new AntBuilder()
ant.unzip(src: file, dest: dir)
Join WNV Data to Natural Earth data
Workspace wk = new Directory("data")
Layer inLayer = wk.get("ne_110m_admin_1_states_provinces_lakes")
Schema schema = inLayer.schema
Schema newSchema = schema.addFields(newFields, "states")
Layer outLayer = wk.create(newSchema)

outLayer.withWriter { Writer w ->
    inLayer.eachFeature { Feature f ->
    	w.add(f)
    }
}

lines.subList(1, lines.size()).each { String line ->
    List items = line.split(",")
    String name = items[0]
    if (name.equals("Dist. of")) {
        name = "District of Columbia"
    }
    Filter filter = new Filter("name='${name}'")
    items.eachWithIndex{ String item, int c ->
        String fieldName = fieldNames[c]
        if (!fieldName.equals("State")) {
            Field field = outLayer.schema.field("y" + fieldName)
            outLayer.update(field, Double.parseDouble(item), filter)
        }
    }
}
Draw maps of WNV spread for each year
List images = years.collect { String year ->
    String name = "y${year}"
    Field field = layer.schema.get(name)
    Gradient style = new Gradient(layer, field, "EqualInterval", 5, "Reds")
    layer.style = style

    Map map = new Map(
        layers: [osm, layer],
        bounds: layer.bounds.expandBy(0.3),
        proj: layer.proj,
        backgroundColor: "white",
        type: "gif"
    )
    def image = map.renderToImage()

    def graphics = image.graphics
    graphics.paint = Color.BLACK
    graphics.font = new java.awt.Font("Arial", java.awt.Font.BOLD, 32)
    graphics.drawString(year,5,30)
    graphics.dispose()
    ImageIO.write(image, "gif", new File(dir, "${year}.gif"))
    image
}

GIF gif = new GIF()
gif.renderAnimated(images, new File(dir, "wnv.gif"), 1000)
WNV Spread by Year
Protected Lands Classification
Goal is to analyze protected lands usage for specific area.
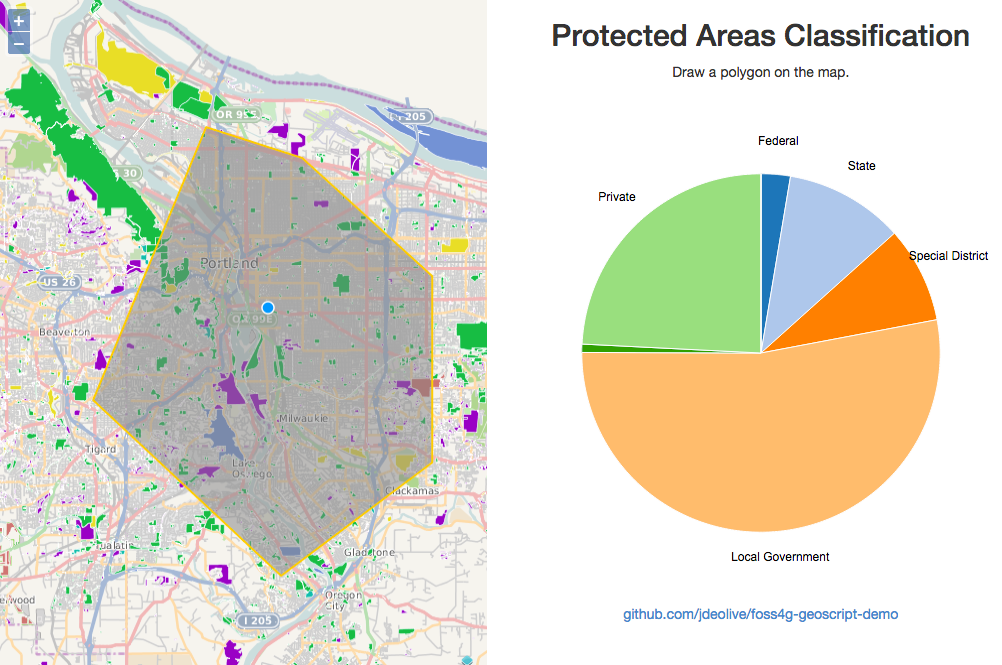 Demo
Demo